Saturday, July 4, 2009

Qt-Embedded: Capturing screen with QPixmap

I've been working on a product manual lately. I needed to include several LCD screenshots into it so I tried to come up with an easy way to capture snapshots from our Qt/Embedded app.
Qt/Embedded provides a nice method to save window/framebuffer contents directly to an image file. However, I wanted to send the 'take-snapshot' command from a tty console (telnet/serial/etc) since there weren't any other buttons on the system to trigger that.
A QTimer is set up. Periodically it checks the file /tmp/doCapture. If it exists a snapshot is taken and an image file is saved. Its filename is taken from the contents of /tmp/doCapture. After saving the image /tmp/doCapture is deleted.
Here is the code, which should be placed in the main window, whose width and height cover the whole screen:


mainWindow::mainWindow()
{
// captureTimer should be declared in mainWindow's class definition
captureTimer = new QTimer(this);
connect( captureTimer, SIGNAL(timeout()), this, SLOT(captureTimerEvent()) );

captureTimer->start(1000); //check interval
}

void mainWindow::captureTimerEvent()
{
QString tmpFile = QString("/tmp/doCapture");

if ( !QFile::exists(tmpFile) )
return;

QFile f(tmpFile);
if ( !f.open( QIODevice::ReadWrite ) )
return;

char buf[200];
if ( f.readLine( buf, sizeof(buf) - 4 ) == -1 )
return;

buf[strlen(buf)-1] = '\0'; //remove \n created by 'echo'-- not safe!

strcat( buf, ".png" );

//capture
QPixmap p = QPixmap::grabWindow( this->winId() );

if ( p.save( buf ) )
printf("------- GRAB OK\n");
else
printf("------- ERR GRAB!\n");

/* delete file */
f.remove();
}


This way, all I have to do to take a snapshot is to write:

echo pngfilename > /tmp/doCapture

Monday, May 4, 2009

Compiling and using GDB for arm-linux

Some days ago I had to compile gdb manually in order to debug an arm-linux app. It's quite trivial but it's so useful that I thought it would be a nice idea to post the instructions here. Below there are some explanations about debugging remotely with KDevelop.

This was done with gdb-6.8, you can grab it here. It is assumed that arm-linux tools are available (PATH correctly set).

Compiling the GDB client

Decompress gdb-6.8 and compile it by issuing:


tar xvf gdb-6.8.tar.gz
cd gdb-6.8
./configure --build=x86 --host=x86 --target=arm-linux
make

After compiling just copy gdb/gdb to arm-linux-gdb where the arm-linux toolchain binaries reside (this is purely for organization and proper naming). You can now remove the gdb-6.8 directory.

NOTE: if your host computer architecture isn't intel-based just replace x86 by the correct value for your platform.

Compiling the GDB server (ARM)

Decompress gdb-6.8 and compile it by issuing:


tar xvf gdb-6.8.tar.gz
cd gdb-6.8
./configure --host=arm-linux
make

After compiling just copy gdb/gdbserver/gdbserver to your arm-linux filesystem so that you can execute it from a remote shell (gdbserver will be an arm-elf binary). You can now remove the gdb-6.8 directory.

Testing connections

First the server should be started in the  arm processor by issuing something like:


gdbserver host:1234 _executable_

Where _executable_ is the application that is going to be debugged and host:1234 tells gdbserver to listen for connections to port 1234.

To run gdb just type this in a PC shell:


arm-linux-gdb --se=_executable_

After that you'll get the gdb prompt. To connect to the target type:


target remote target_ip:1234

To resume execution type 'continue'. You can get an overview on gdb usage here.

Debugging with KDevelop

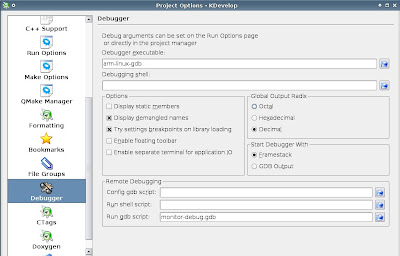
KDevelop can be used to watch variables and debug the remote target (place breakpoints, stop execution, etc). Just go to Project -> Project Options and make sure you have something like this:


monitor-debug.gdb is a file that contains the following


target remote target_ip:1234

After this you will be ready to remotely debug any arm-linux application.

_

Tuesday, April 28, 2009

Catching uncaught exceptions in Java

This month looks quite javaized!
So here is another thing I came up with, regarding uncaught exceptions which usually end the application totally unexpectedly. I wouldn't mind about that, but I felt that the user should be notified with a minimum-sense message and some technical info so that he/she can send it over to the developers.
So here it is a 'BodyGuard' class that does the job by using a callback present in the Thread class.


package bodyguard;

public class BodyGuard implements Thread.UncaughtExceptionHandler
{
static private BodyGuard bGuard;

static public void registerGuard() {
bGuard = new BodyGuard();
Thread.setDefaultUncaughtExceptionHandler(bGuard);
}

public void uncaughtException( Thread thread, Throwable e )
{
java.io.StringWriter sW = new java.io.StringWriter();
e.printStackTrace( new java.io.PrintWriter(sW));

String s = "A fatal error was detected during execution: \n" +
"Thread: " + thread.getName() + "\n" +
"Exception: " + sW.toString() + "\n" +
"The application will be closed now.";

showFatalErr(s);
}

private void showFatalErr( String err )
{
//JOptionPane.showMessageDialog(null, err,"Error", JOptionPane.ERROR_MESSAGE);
BodyGuardDialog dlg = new BodyGuardDialog(null, true, err);
dlg.setLocationRelativeTo(null);
dlg.setVisible(true);

System.exit(-1); //exit n ow
}
}

BodyGuardDialog is another class derived from JDialog that shows the corresponding error message and lets the user copy the error to the clipboard.
In order to register this handler one just has to call bodyguard.BodyGuard.registerGuard() when starting up (ie: static void main()).
This class will catch uncaught exceptions from all threads, displaying the thread's name where the exception was thrown.
_

Tuesday, April 21, 2009

Java Application and self-restart

Java's networking capabilities and prebuilt classes make self-updating applications an easy task for developers. A simple method is to store a file containing current version number on a web host, together with a zipped/tared file containing the whole or partial application files to update.

Also, java applications are truly self-updatable since the application itself can overwrite its class files (or jar ones), since the java VM loads all its contents into memory before start up (except for dynamic 'late' class loading).

After coding the necessary classes to perform the update I realised I needed a way to tell java to restart the application, loading the updated code from the new class files. There wasn't an automated way to do this, so I came up with the next piece of code which invokes the java VM to execute the JAR file where certain class belongs to.


public boolean restartApplication( Object classInJarFile )
{
String javaBin = System.getProperty("java.home") + "/bin/java";
File jarFile;
try{
jarFile = new File
(classInJarFile.getClass().getProtectionDomain()
.getCodeSource().getLocation().toURI());
} catch(Exception e) {
return false;
}

/* is it a jar file? */
if ( !jarFile.getName().endsWith(".jar") )
return false; //no, it's a .class probably

String toExec[] = new String[] { javaBin, "-jar", jarFile.getPath() };
try{
Process p = Runtime.getRuntime().exec( toExec );
} catch(Exception e) {
e.printStackTrace();
return false;
}

System.exit(0);

return true;
}

There are some important aspects to have in mind for this code:

  • The application's main class must be in a jar file. classInJarFile must be an instance of any class inside the same jar file (could be the main class too).
  • The called java VM will be the same that the application is currently running on.
  • There is no special error checking: the java VM may return an error like class not found or jar not found, and it will not be caught by the code posted above.
  • The function will never return if it doesn't catch an error. It would be a good practice to close all the handlers that could conflict with the 'duplicate' new application before calling restartApplication(). There will be a small time (which depends on many factors) where both applications will be running at the same time.

The code can be easily modified for a class file approach rather than jar ones.

A bash script or .bat (Windows) would work, calling the application indefinitely in the case the process' return value matches a specified number (which would be set after a successful upgrade). However, this wouldn't be platform independent.

Wednesday, March 25, 2009

Loop unrolling and speed-up techniques

Today I started some investigation on DTMF detection. After some research I decided to try the Goertzel algorithm, wrote some code from scratch and tried it on a real equipment based on an ARM7 core. It did fine actually, but after some benchmarking I thought it was somewhat slow.

I wrote the code thinking on future optimization but keeping simplicity in mind, specially because I didn't know how it was going to behave. However, as said above, calculations took much longer than what I expected, even though they were quite fast, exceeding the requirements for real-time processing (telephone channel, 8khz, mono). I still wanted to keep the code in C for portability so I tried some tricks.

I wrote the code with fixed-point math in mind, since floating point arithmetic would kill performance.

First, here are some basic definitions:


/* Struct for a single Goertzel calculator */
typedef struct
{
dsp_t sp1,sp2; //past values (IIR)
dsp_t coeff; //calculated only once

} GOERTZ_s;

/* Calculate Goertzel 'step' */
#define GOERTZ_calc( _s, _val ) \
{ \
dsp_t _gs = (_val) + FP_MULT2( _s.coeff, _s.sp1 ) - _s.sp2; \
_s.sp2 = _s.sp1; \
_s.sp1 = _gs; \
}

The first approach was the simplest one, I needed sixteen Goertzel calculations (8 frequencies + 8 second harmonic for the first frequencies). I had a buffer where the incoming PCM data was copied to so I had to process that array for each of the 16 Goertzel 'calculators'.


static inline void GOERTZ_processAll( dsp_t sample )
{
int i;
for (i=0; i < 16; i++)
GOERTZ_calc( goertzs[i], sample );
}

/* this is inside another function */
int i;
for (i=0; i < BUFFER_SIZE; i++)
GOERTZ_processAll( bufferData[i] );


Where BUFFER_SIZE is the size of bufferData[] and goertzs[] is a 16-element array of GOERTZ_s structs, already initialized. Notice the inline modifier in GOERTZ_processAll(). It's really important since function inlining will help in execution time, specially when the function is called so frequently.

That code worked alright, but was too slow, at least for my intuition. The progress into a more efficient scheme had many steps, but basically there were three important changes:

  • dsp_t was defined as int16_t, but the processor's 'native' word length is 32-bit, so changing dsp_t to be int32_t speeded up the calculations by removing cast and special assignment instructions.
  • Loop unrolling was done in GOERTZ_processAll(). That means more flash is used but it's a good price to pay for a good speed up. Besides that, here we are talking about repeating the same thing 16 times so it's not a big problem if we have, to say, a 512k flash microcontroller or dsp.
  • Instead of passing a single value to GOERTZ_processAll() a 8-byte array is used. This improves time considerably but also increases code size. As said in the previous point that wasn't an issue this case. Note that a 16-byte array won't necessarily increase performance. It depends on the core architecture, and in this case it made things worse (but better than single value parameter passing).

With these modifications I got a 100% performance increase, which means that there can be twice as much DTMF decoders compared to the non-optimized version.

Here is the code with the modifications:


static inline void GOERTZ_processAll( dsp_t samples[8] )
{
#define DO(j) \
GOERTZ_calc( goertzs[j], samples[0] ); \
GOERTZ_calc( goertzs[j], samples[1] ); \
GOERTZ_calc( goertzs[j], samples[2] ); \
GOERTZ_calc( goertzs[j], samples[3] ); \
GOERTZ_calc( goertzs[j], samples[4] ); \
GOERTZ_calc( goertzs[j], samples[5] ); \
GOERTZ_calc( goertzs[j], samples[6] ); \
GOERTZ_calc( goertzs[j], samples[7] );

DO(0);
DO(1);
DO(2);
DO(3);
DO(4);
DO(5);
DO(6);
DO(7);
DO(8);
DO(9);
DO(10);
DO(11);
DO(12);
DO(13);
DO(14);
DO(15);

#undef DO
}
/* somewhere in another function */
int i;
for (i=0; i < BUFFER_SIZE; i +=8 )
GOERTZ_processAll( bufferData + i );

But it can do better...

After observing how good performance went after this modifications I tried to do more loop unrolling to see if I could improve it. If the data buffer is large enough then the for loop that process 8 samples at a time wastes useful CPU instructions, so I included it inside a function called GOERTZ_processBuffer() which takes a buffer pointer and its length. There was another 100% performance increase from the previous optimization. This means a 4x speed up from the original code! Note that, once again, more flash is being used for loop unrolling.


static inline void GOERTZ_processBuffer( dsp_t *samples, int num )
{
#define DO(j) \
for ( i=0; i < num; i+=32 ) { \
GOERTZ_calc( gss[j], samples[0+i] ); \
GOERTZ_calc( gss[j], samples[1+i] ); \
GOERTZ_calc( gss[j], samples[2+i] ); \
GOERTZ_calc( gss[j], samples[3+i] ); \
... up to 32 .. ; }


DO(0);
DO(1);
DO(2);
DO(3);
DO(4);
DO(5);
DO(6);
DO(7);
DO(8);
DO(9);
DO(10);
DO(11);
DO(12);
DO(13);
DO(14);
DO(15);

#undef DO
}

Wednesday, March 18, 2009

QTimer and no monotonic clock support

I found myself dealing with qt-embedded and QTimers again. There's a board whose software configuration doesn't support monotonic clocks so changing the date back in time causes running QTimer's to cease activity.

I chose to patch qt-embedded 4.5.0. The fix is simple, I just had replace this function in src/corelib/kernel/qeventdispatcher_unix.cpp


void QTimerInfoList::registerTimer(int timerId, int interval, QObject *object)
{
QTimerInfo *t = new QTimerInfo;
t->id = timerId;
t->interval.tv_sec = interval / 1000;
t->interval.tv_usec = (interval % 1000) * 1000;
t->timeout = updateCurrentTime() + t->interval;
t->obj = object;
t->inTimerEvent = false;

timerInsert(t);
}

by this one:


void QTimerInfoList::registerTimer(int timerId, int interval, QObject *object)
{
/** add this 2 lines */
updateCurrentTime();
repairTimersIfNeeded();

QTimerInfo *t = new QTimerInfo;
t->id = timerId;
t->interval.tv_sec = interval / 1000;
t->interval.tv_usec = (interval % 1000) * 1000;
t->timeout = updateCurrentTime() + t->interval;
t->obj = object;
t->inTimerEvent = false;

timerInsert(t);
}

After that qt-embedded should be recompiled (a full recompilation isn't needed, the only file that needs to be compiled again is the one modified, and then a full relink and install; make will do the job).

What happens is that everytime a timer is registered, Qt will update the current time and try to fix the timers if it's needed. This will make newly registered timers work after the date is changed backwards, but old timers won't run properly. I created a class which tracks the QTimers present in the application so that it is able to stop and start them again. This is not the best solution but I had to do a quick fix on this and it works.

Wednesday, March 4, 2009

Some code metrics

I recently received an email with Jack Ganssle's last Embedded Muse, mentioning two tools to calculate code metrics. I wanted to try one of them so I downloaded SourceMonitor.

I ran SourceMonitor and computed the statistics for one of the largest projects I'm working on (embedded ARM7 processor, ethernet, USB along with live audio recording/playing among other functions). I got impressed by some numbers, here are the results:


NOTE:SourceMonitor processed my code only, excluding the TCP/IP stack and the FreeRTOS code which is part of the firmware too.


Files191
Lines34,019
Statements12,765
Percent Branch Statements19.9
Percent Lines with Comments26.1
Functions538
Average Statements per
Function
25.7
Average Block Depth1.54

One of the first things that impressed me was the fact that 26% of the lines are comments, which is something I'm glad of, considering how hard it can be to maintain such a large project, specially if someone else who never got in touch with this code needs to change or add some functionality or worse: correct a bug. However, there is a trick here which may help SourceMonitor to show a percentage way high from an intuitive value: I usually comment functions in Doxygen style, so one to two lines are 'wasted' in spite of code clarity.

Regarding real statements, 12,765 lines mean about 37% of the total line count. This may look like an unbelievable lie, but actually it's due to many blank lines and comments that improve code readability. SourceMonitor's help clearly explains what 'statements' mean for C coding: "Statements: in C, computational statements are terminated with a semicolon character. Branches such as if, for, while, and goto are also counted as statements. Preprocessor directives #include, #define, and #undef are counted as statements. All other preprocessor directives are ignored. In addition all statements between an #else or #elif statement and its closing #endif statement are ignored, to eliminate fractured block"

Another interesting value is the one regarding the average of statements per function. Modularization and splitting code into relatively is a well known good practice that helps to ease code understanding and extension and also bug solving.

There are other metrics not calculated by SourceMonitor which would be nice to investigate, like preprocessor usage (#define, #else, #if, etc) which is something I often abuse of (in a good sense). It would be nice to be able to count the number of defined macros and macro usage too.

It is also important to remember that code metrics is just one side of the code. Lines can be counted and many statistics can be plotted but code organization is not something easy to measure. I could now say that I spent 26% of the time writing comments, which would sound scary to some people. I could also say I spent 37% of the time coding real statements. Both are big lies. Most of the time is spent thinking on how to implement this or that functionality and probably testing it does right (debugging takes time too). Coding is usually quite straight forward once one's brain is organized: that is, of course, not measurable with SourceMonitor.

UPDATE: I downloaded cloc and ran it over the same code, obtaining nearly 7200 blank lines which is about 21%, which I guess should have it's own post ;) The linux kernel 2.6.26 had about 13% of blank lines (see here), I guess I might be overcoding for beauty...